


Added Sugars Intake in the United States
For more than 20 years, added sugars consumption has been on a significant decline in the United States.1-5 Since 2000, people of all ages have been consuming fewer added sugars with mean intakes down by 30% (from 24.3 to 16.9 teaspoons equivalents per day).8,9
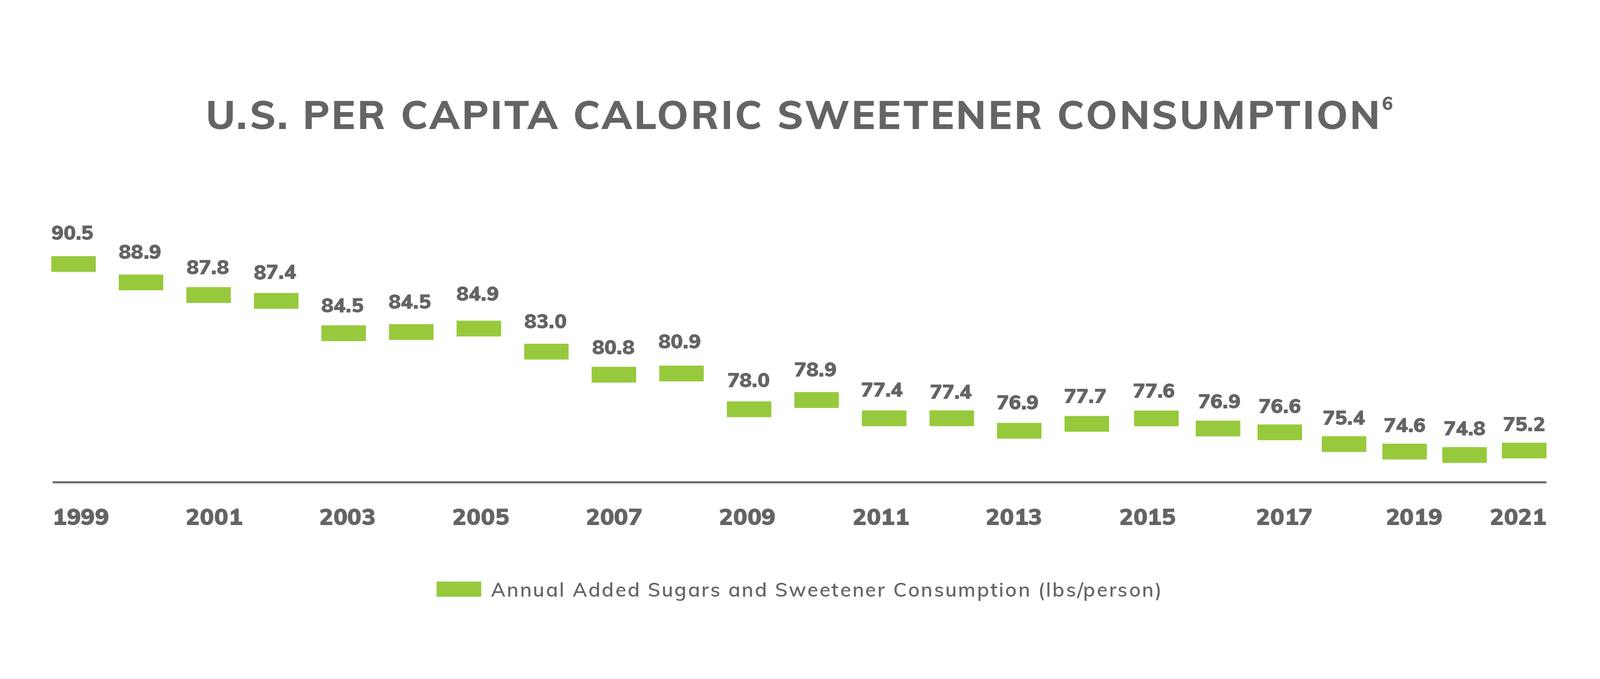
Daily added sugars intake can be presented in teaspoons (tsp), grams (g), calories (kcals) or % of total calories. The 2020-2025 Dietary Guidelines for Americans⁷ recommends daily intake of added sugars make up less than 10% of total calories. In a 2,000 calorie diet, this translates to: 12 tsp, 50 g, 200 kcals, 10% of total calories.
Percent of Calories from Added Sugars¹˒⁸˒⁹
| Year | % of Calories from Added Sugars |
|---|---|
| 1999-2000 | 18.1 |
| 2001-2002 | 17.1 |
| 2003-2004 | 15.9 |
| 2005-2006 | 14.5 |
| 2007-2008 | 14.6 |
| 2009-2010 | 13.9 |
| 2011-2012 | 14.1 |
| 2013-2014 | 13.4 |
| 2015-2016 | 12.6 |
| 2017-2018 | 12.9 |
Added sugars consumption in 2017–2018 is reported to be about 13% of total calories, or around 270 calories per day.8,9 This is still slightly above the Dietary Guidelines for Americans, as the 2020-2025 recommendations suggest no more than 10% of calories from added sugars per day.7
What We Eat in America (WWEIA) captures U.S. dietary intakes as a part of National Health and Nutrition Examination Survey (NHANES). This survey is conducted every two years in partnership with the United States Department of Agriculture (USDA) and Health and Human Services (HHS) to assess the health and nutritional status of Americans.10
Total added sugars intake is on the decline, but how much actual sugar (or sucrose) are we consuming?
Dietary data are frequently reported as total added sugars, a combination of the intakes of all caloric sweeteners: sugar, high-fructose corn syrup, honey, maple syrup, etc. But, if we look at just sugar intake, the story is a little different. From 1970 to 2019, consumption of sugar (sucrose) from sugar beets and sugar cane has decreased by more than 30%, a drop from 283 calories (17.7 tsp) per day to 190.4 calories (11.9 tsp) per day.6
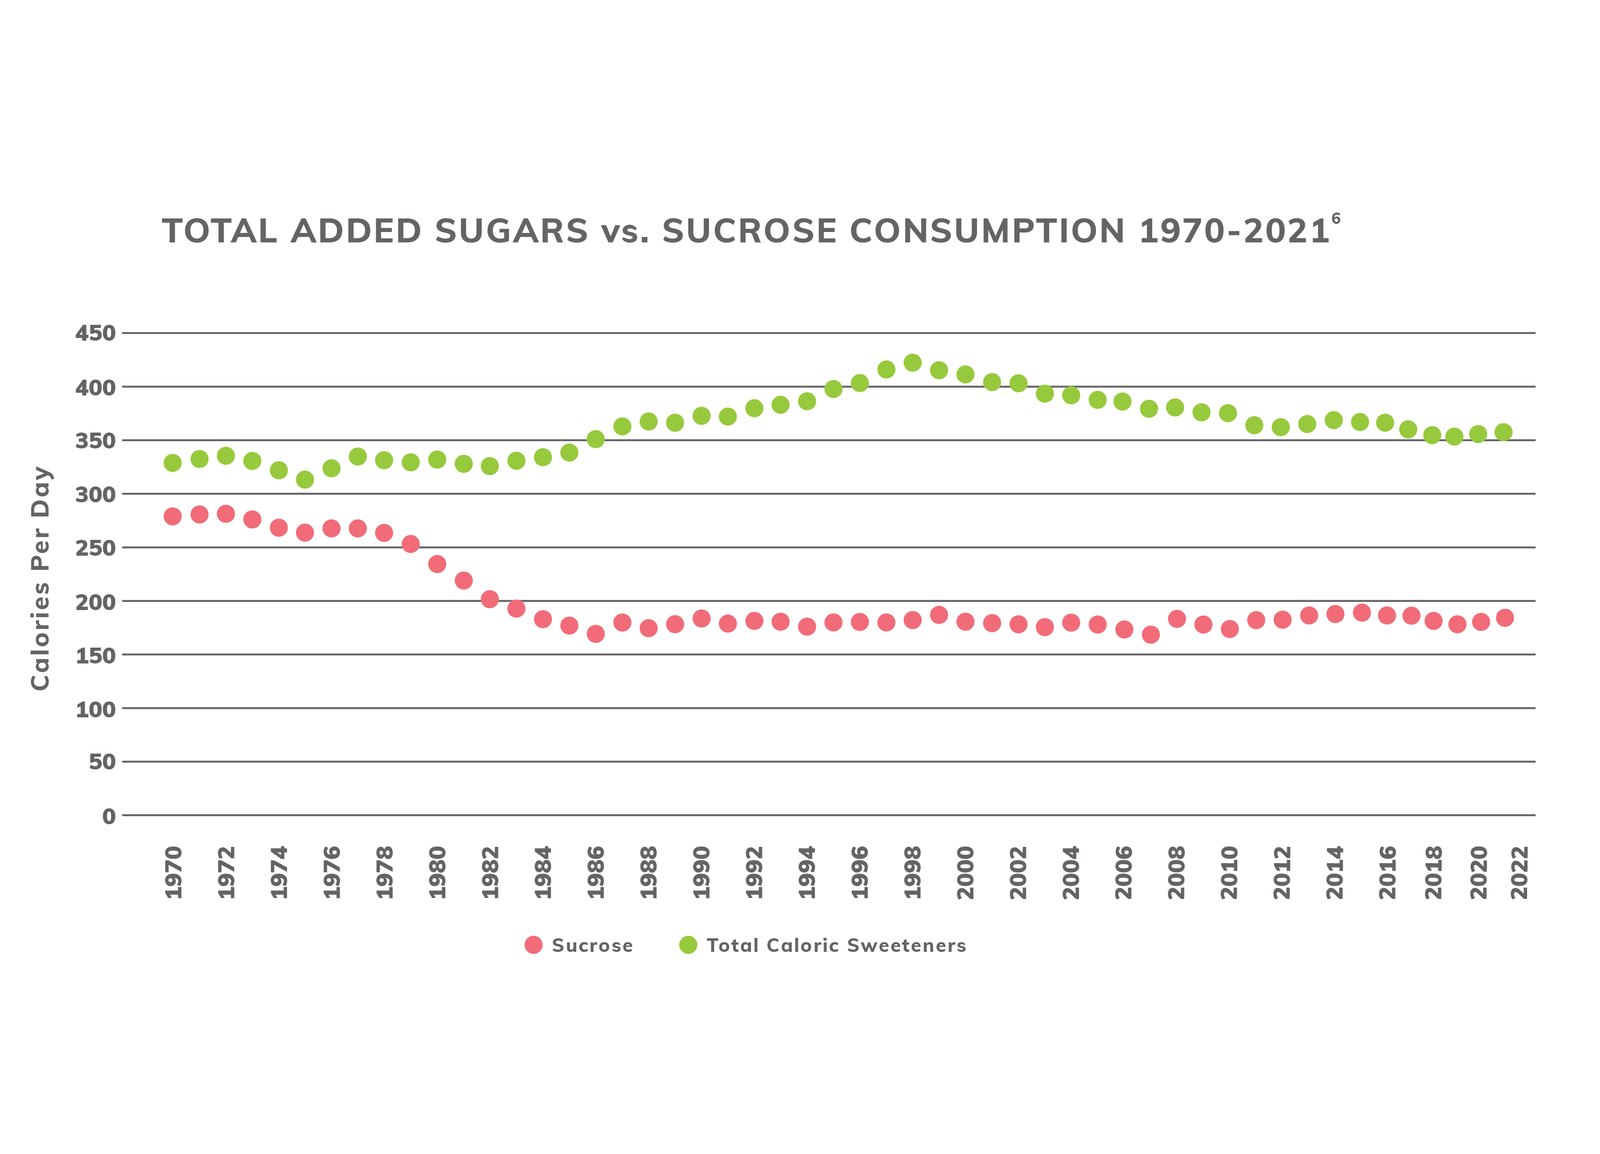
While added sugars consumption increased sharply in the 90’s, intakes today have come back down and are very close to what they were in 1970. Compared to 1970, daily added sugars consumption has increased by just 10 calories.⁶
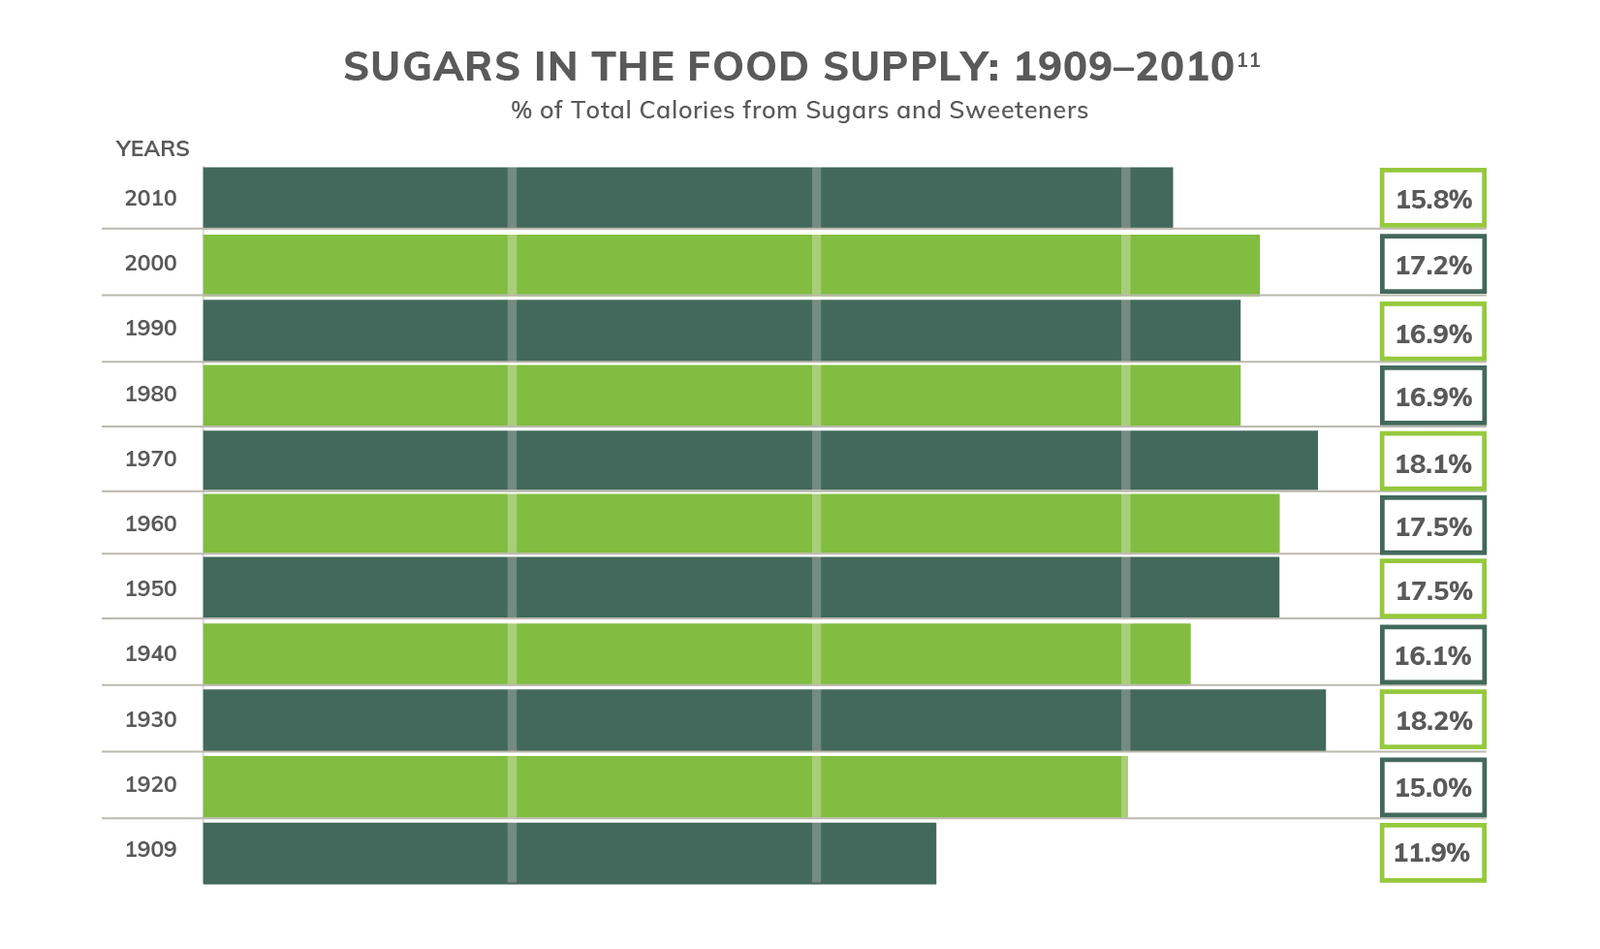
Going way back
The USDA has been collecting food supply data for a long time! Looking back over 100 years, sugars and sweeteners made up 11.9% of all calories in the food supply in 1909. Over the past century there have been some ebbs and flows in this percentage, the highest being 18.2% in 1997-1999. However, since the turn of the century, the percentage of calories from sugars and sweeteners has dropped steadily. It is important to note that total calorie intake has come up since 1909, but as a percentage of total calories, total sugars and sweeteners consumption is on the decline.¹¹
National Data Sets
Did you know that the USDA has been monitoring food supply data since 1909? This extensive history shapes our insights on dietary trends and Americans’ food intake.
For a brief, printable summary of sugar intake trends, click here
References:
1. Welsh JA, Sharma AJ, Grellinger L, Vos MB. Consumption of added sugars is decreasing in the United States. Am J Clin Nutr. 2011; 94:726–34. [PubMed: 21753067]
2. Slining MM, Popkin BM. Trends in intakes and sources of solid fats and added sugars among US children and adolescents: 1994-2010. Pediatr Obes. 2013 August;8(4):307–324. doi:10.1111/j.2047-6310.2013.00156.x.
3. Bowman SA, Friday JE, Clemens JC, LaComb RP, Moshfegh AJ. A comparison of Food Patterns Equivalents Intakes by Americans: What We Eat in America, NHANES 2003-04 and 2011-12. USDA Food Surveys Research Group. Dietary Data Brief No. 16. September 2016.
4. Bowman SA, Clemens JC, Friday JE, Lynch KL, LaComb RP, Moshfegh AJ.Food Patterns Equivalents Intakes by Americans: What We Eat in America, NHANES 2003-2004 and 2013-2014. USDA Food Surveys Research Group. Dietary Data Brief No. 17. May 2017.
5. Bowman SA, Clemens JC, Friday JE, Lynch KL, LaComb RP, Moshfegh AJ. Food Patterns Equivalents Intakes by Americans: What We Eat in America, NHANES 2003-2004 and 2015-2016. USDA Food Surveys Research Group. Dietary Data Brief No. 20. November 2018.
6. Food availability (per capita) data system: Loss-adjusted food availability documentation. USDA ERS. https://www.ers.usda.gov/data-products/food-availability-per-capita-data-system/. Updated December 5, 2022.
7. U.S. Department of Agriculture and U.S. Department of Health and Human Services. Dietary Guidelines for Americans, 2020-2025. 9th Edition. December 2020. Available at DietaryGuidelines.gov. Accessed January 14, 2021.
8. U.S. Department of Agriculture, Agricultural Research Service, Beltsville Human Nutrition Research Center, Food Surveys Research Group, Beltsville, Maryland, Food Patterns Equivalents Databases and Datasets. Available at: http://www.ars.usda.gov/Services/docs.htm?docid=23869. Accessed November 25, 2020.
9. U.S. Department of Agriculture, Agricultural Research Service, Beltsville Human Nutrition Research Center, Food Surveys Research Group, Beltsville, Maryland, WWEIA Data Tables. Available at: https://www.ars.usda.gov/northeast-area/beltsville-md-bhnrc/beltsville-human-nutrition-research-center/food-surveys-research-group/docs/wweia-data-
tables/. Accessed November 25, 2020.
10. U.S. Department of Agriculture, Agricultural Research Service, Beltsville Human Nutrition Research Center, Food Surveys Research Group, Beltsville, Maryland, WWEIA/NHANES Overview. Available at: https://www.ars.usda.gov/northeast-area/beltsville-md-bhnrc/beltsville-human-nutrition-research-<brcenter/food-surveys-research-group/docs/wweianhanes-overview/. Accessed April 10, 2018.
Sources of Added Sugars
Sugar & the Diet Sources of Added Sugars Where are our added sugars coming from? Sugar has benefits that go […]
Learn More 🡢Sugar's Role in Food
Sugar & the Diet Sugar’s Role in Food Think beyond sweetness. Sugar can give foods the sweet taste we know […]
Learn More 🡢